Creative Reporting
Built a monthly creative reporting system that scaled from manual tracking to full automation by 2025. Delivered a 16‑page report used by creatives, VPs, and executives to track workload, turnaround times, and trends, improving planning, visibility, and decision‑making across the team.
Step 1: Auditing for Accuracy
Each report began with a quality check. Data was pulled from Jira using extensions and structured formulas to capture key fields and status changes. Because accuracy mattered, I conducted a quick audit directly in Jira to catch any tickets that hadn’t filtered correctly. If something didn’t match, I traced it back to the source and corrected it at the ticket level.
This step ensured the data reflected reality, not assumptions.
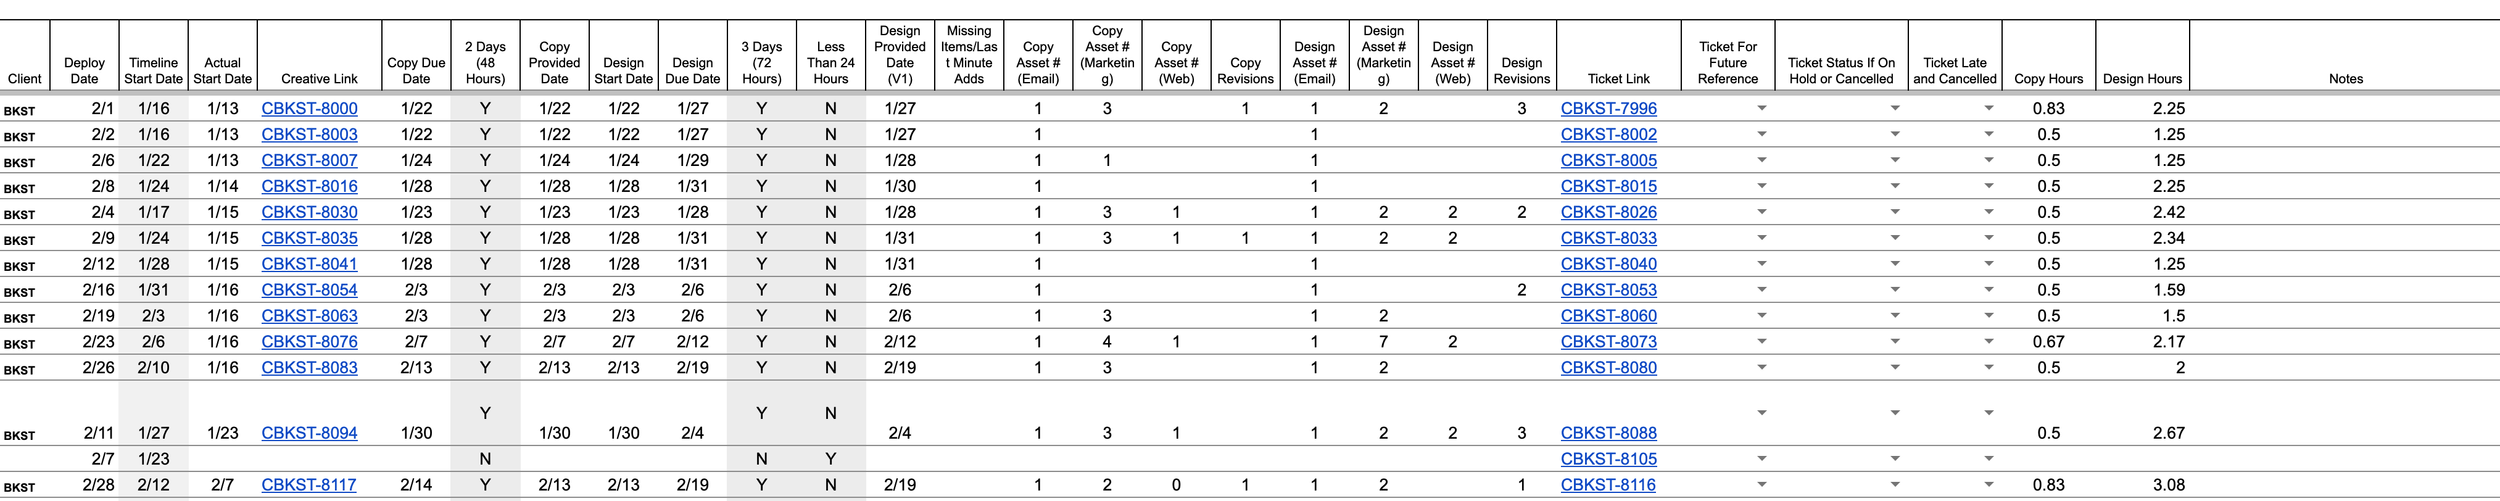
A snapshot of the audit in the spreadsheet. The data was automated to refresh hourly through the Jira extension.
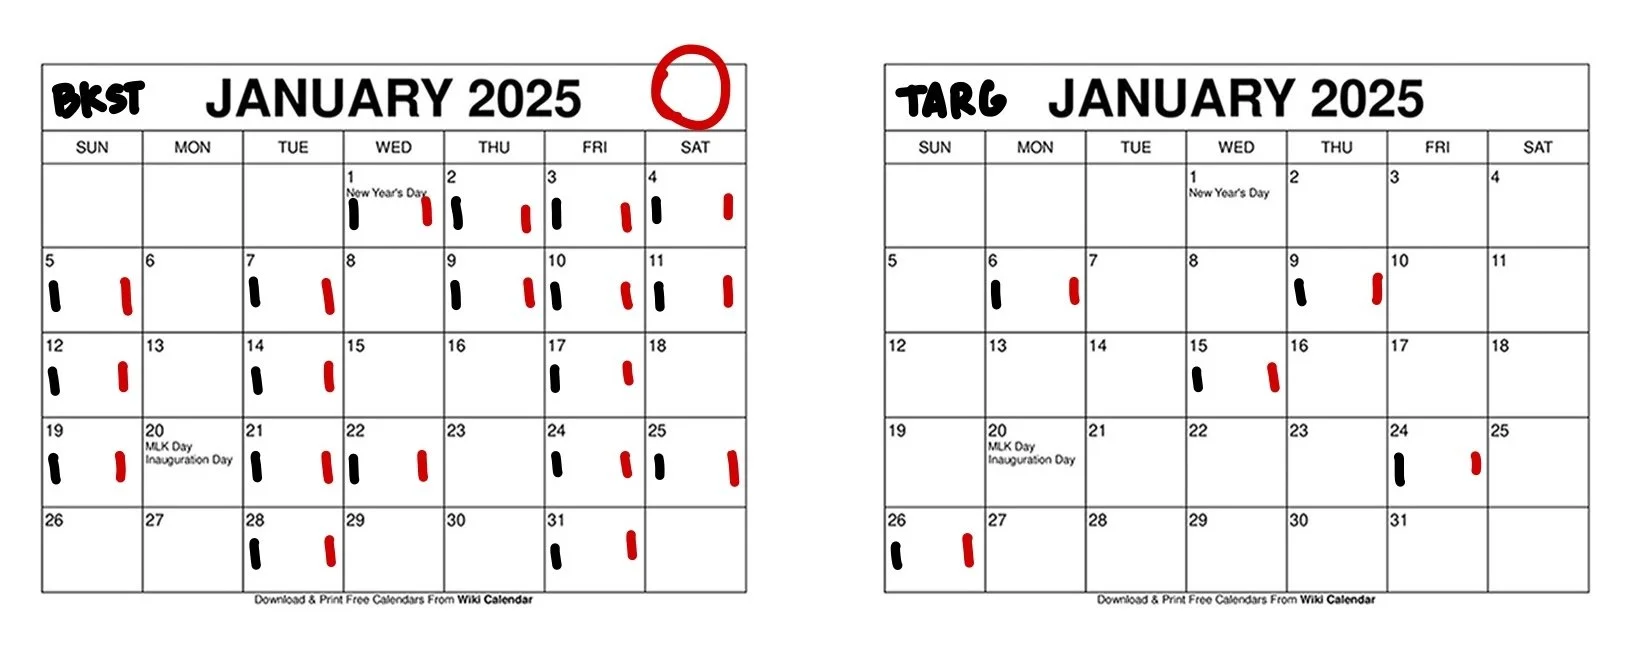
The quick audit performed in Jira. Black was in Jira and Red was in the spreadsheet.
Step 2: Structured Data Collection
Once the data was clean, I used the Jira API and custom scripts to capture precise timestamps and actions. For example, when a ticket moved from one status to another by a specific role, the system recorded the exact date and time automatically.
This level of precision allowed us to understand turnaround times, workload distribution, and where friction was actually happening.
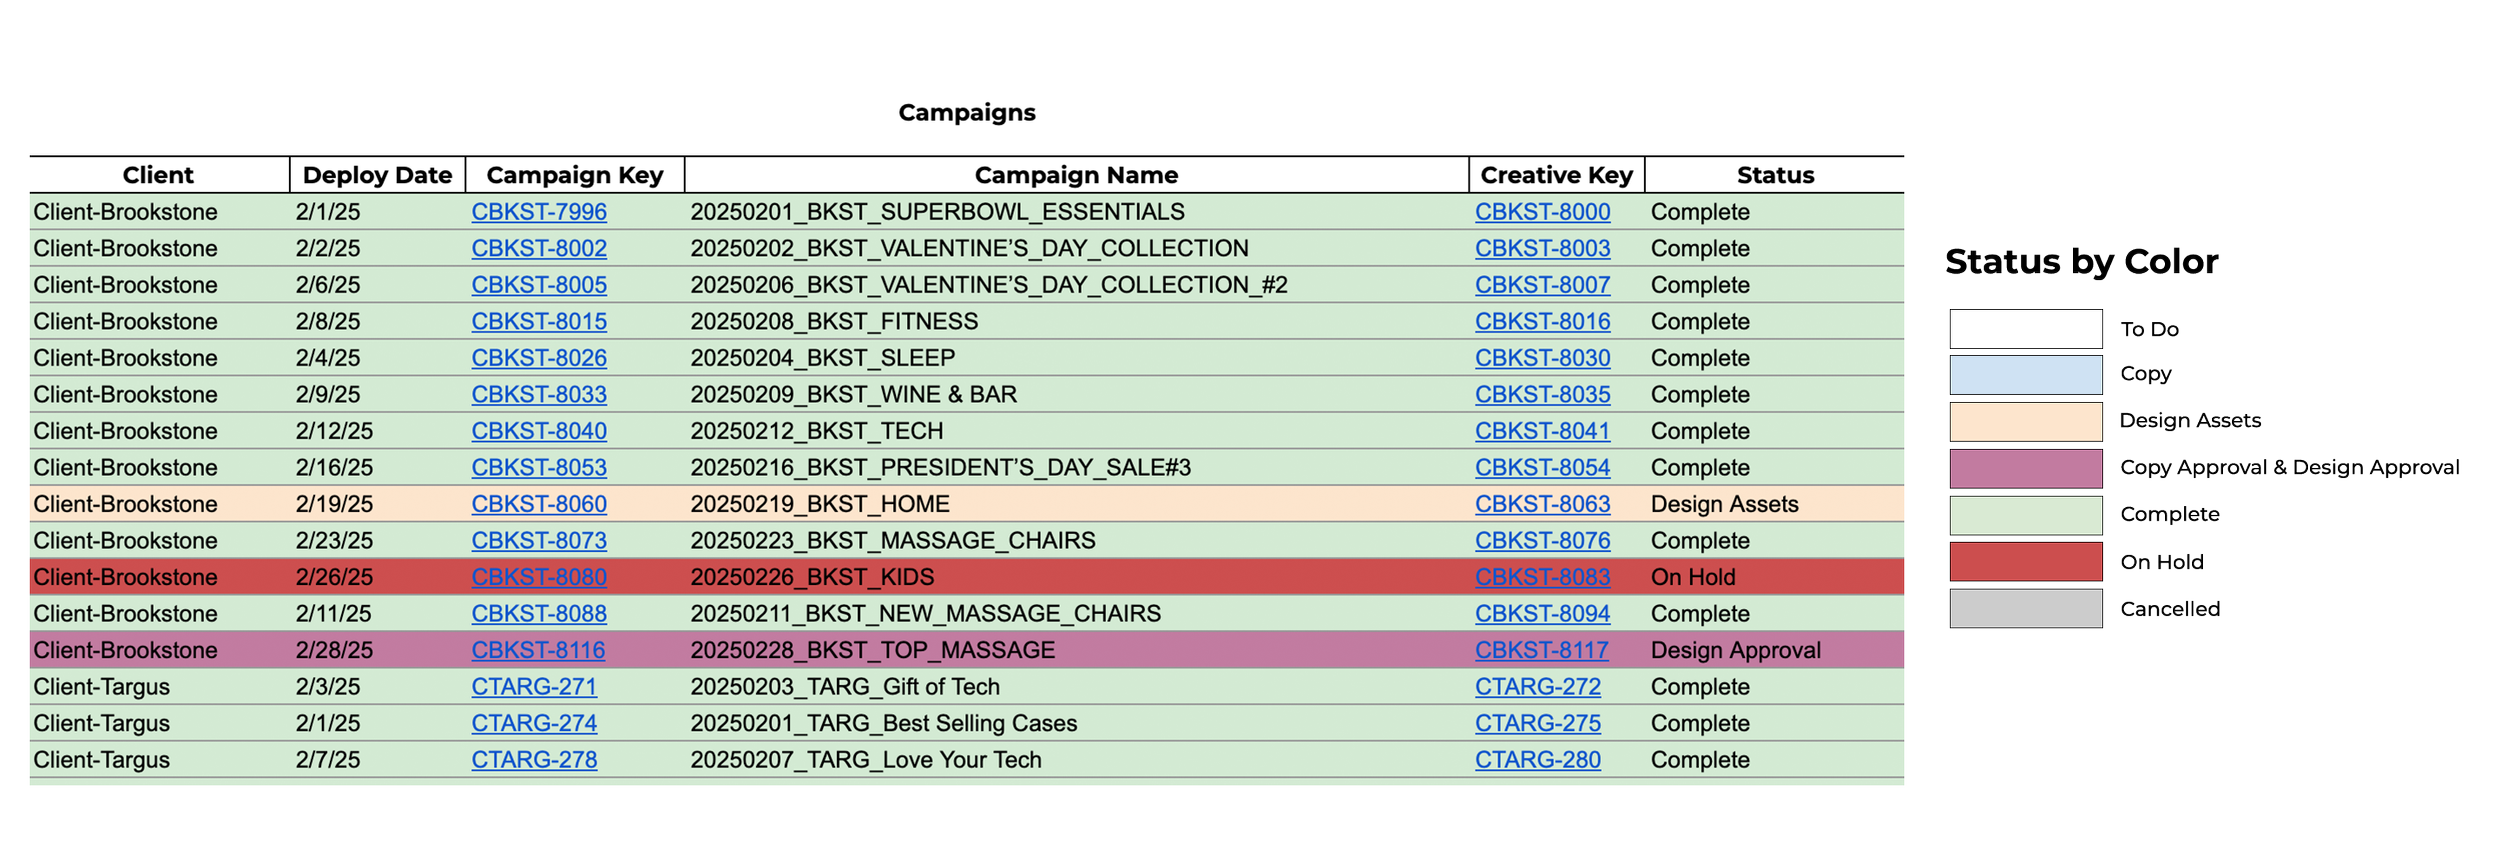
The raw data from the Jira tickets
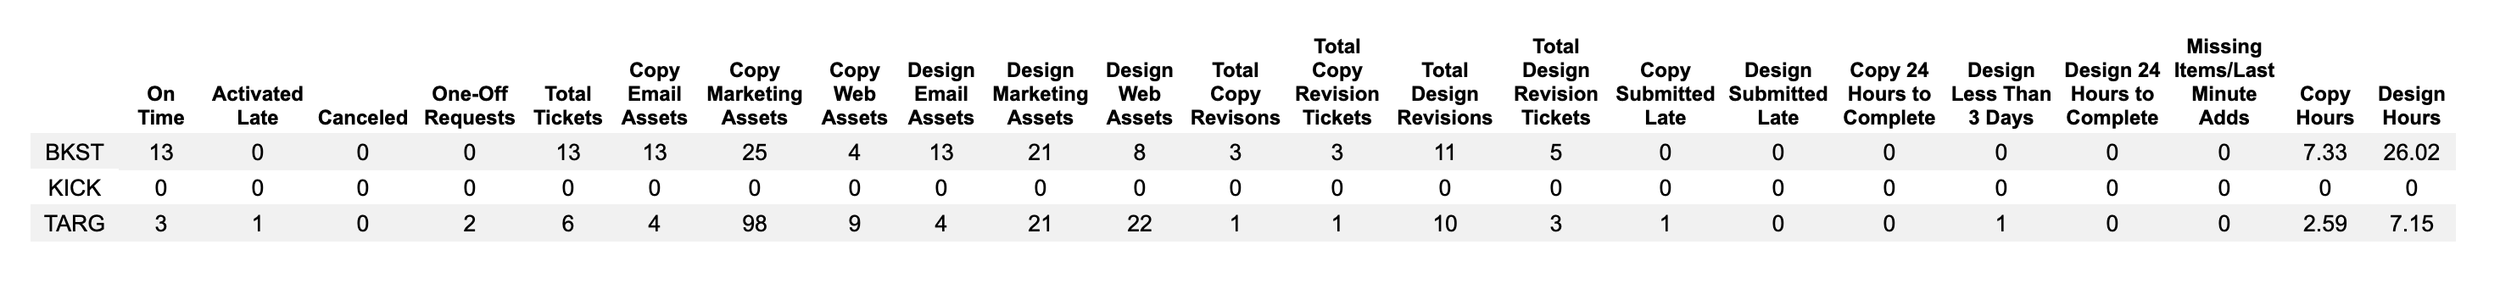
The data organized by client
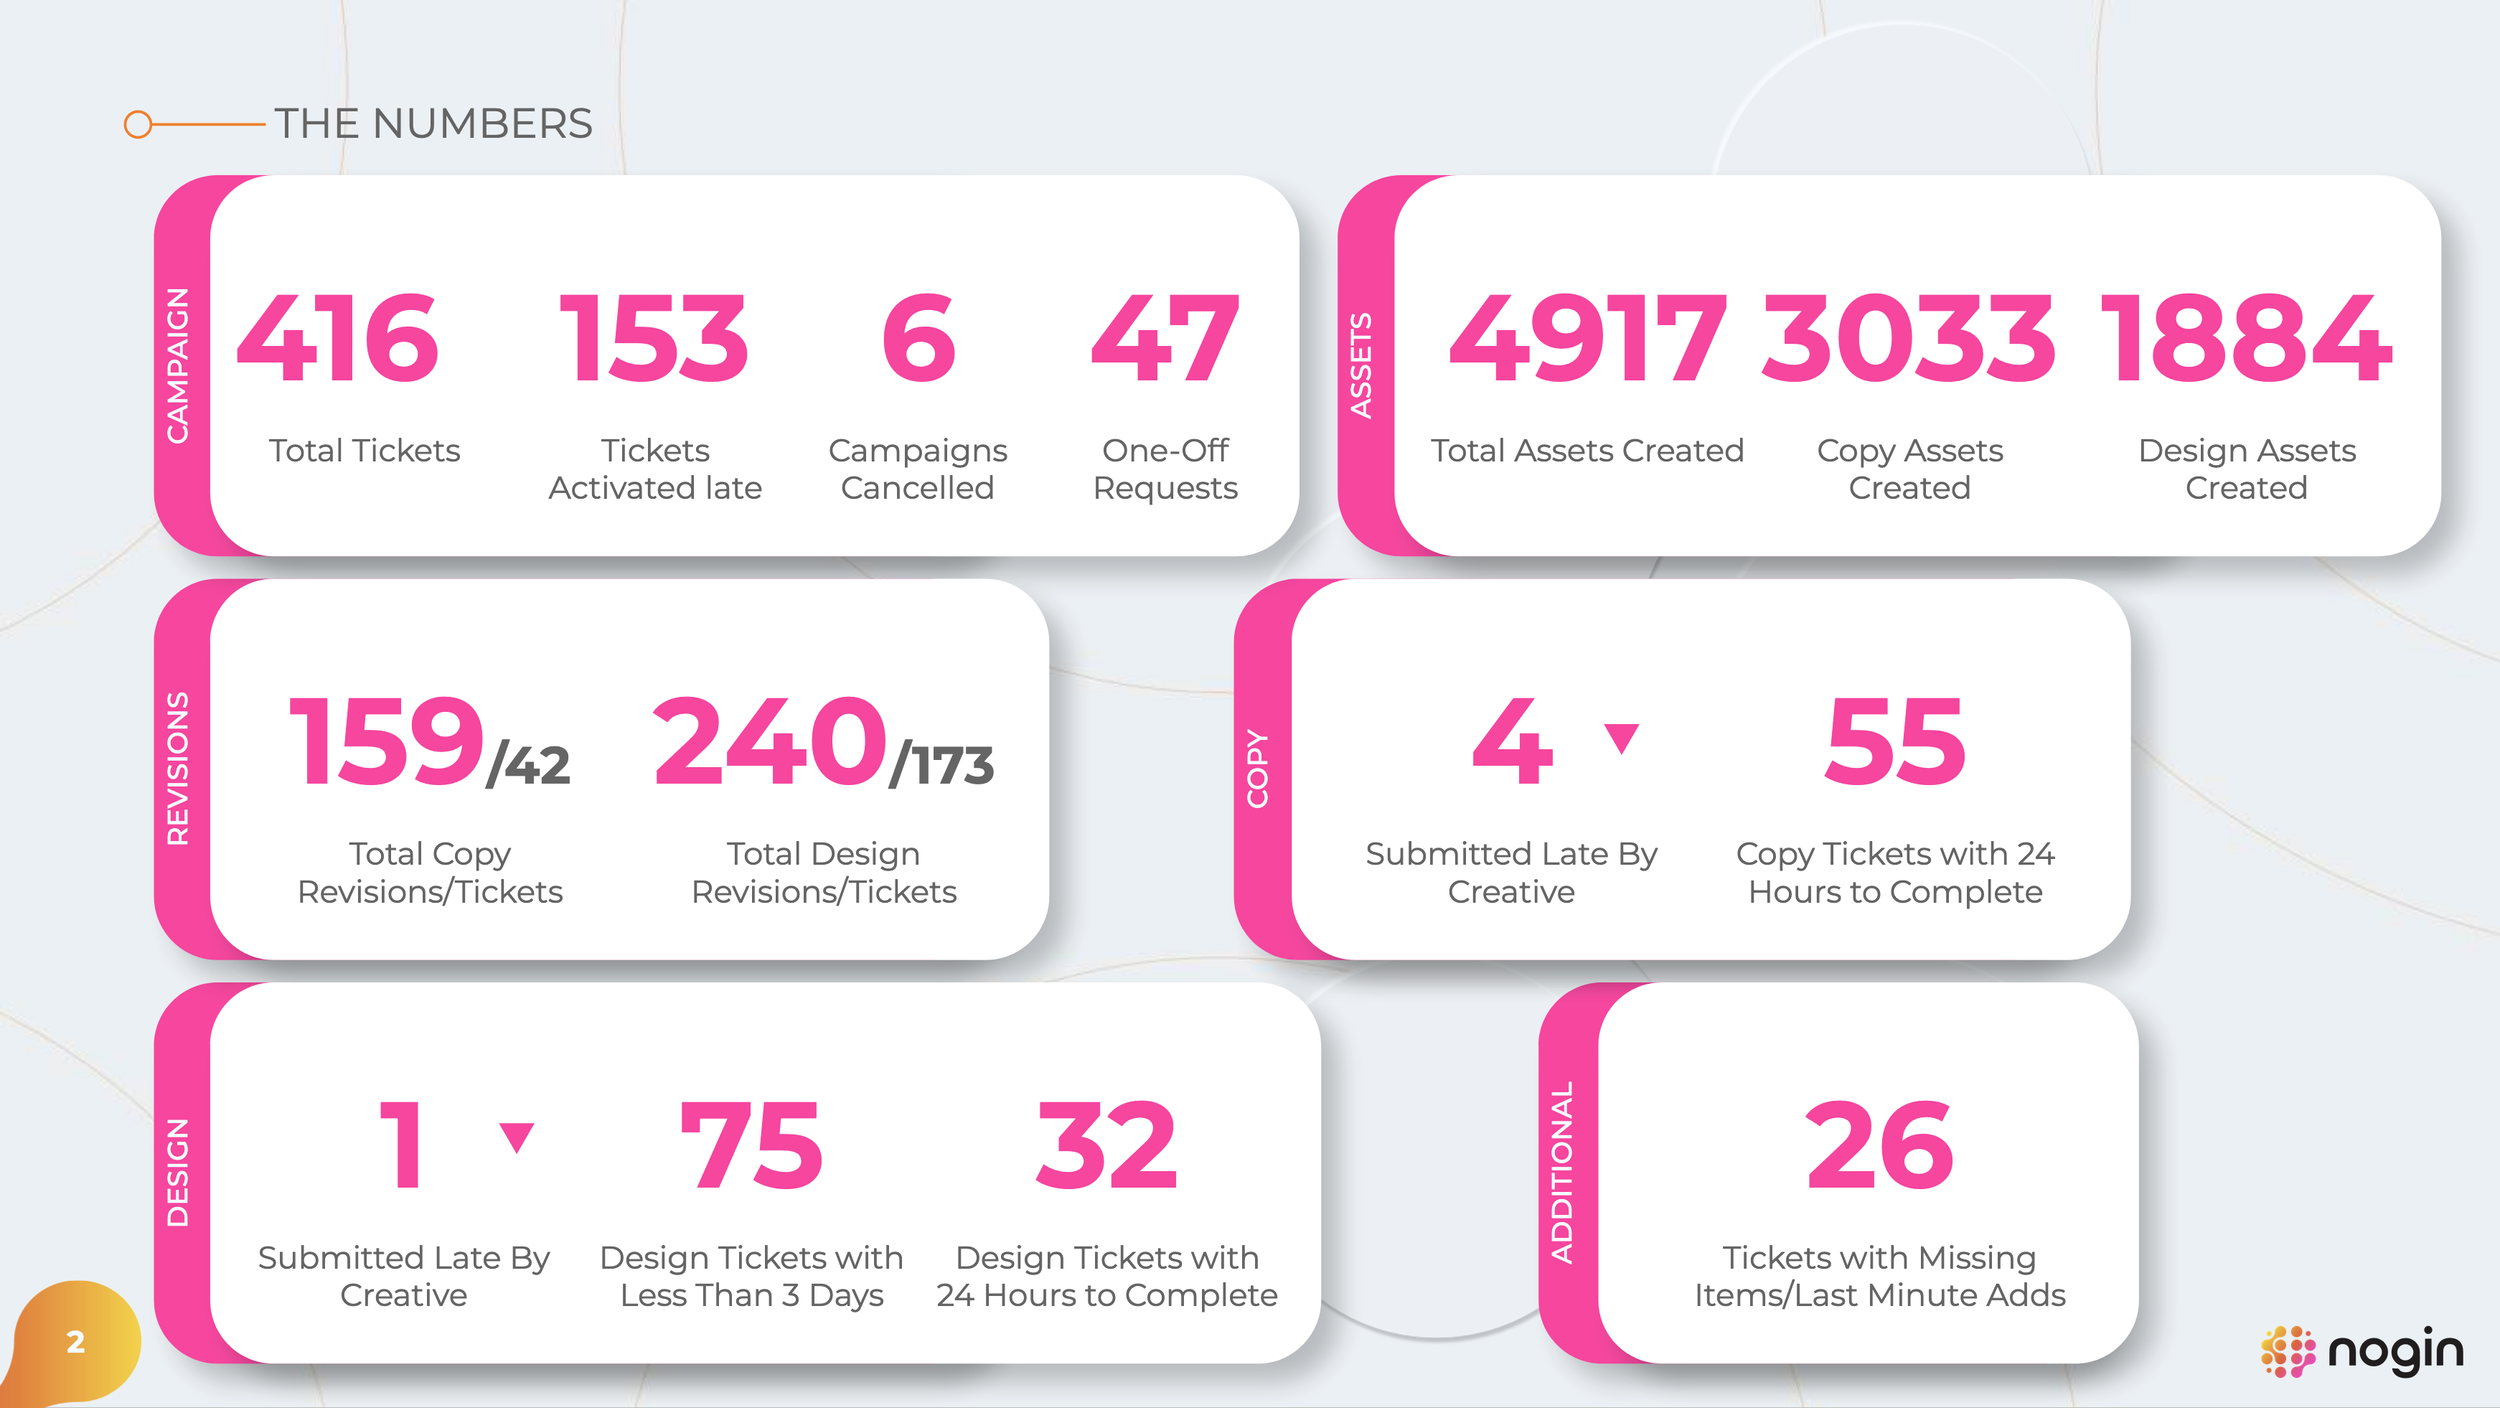
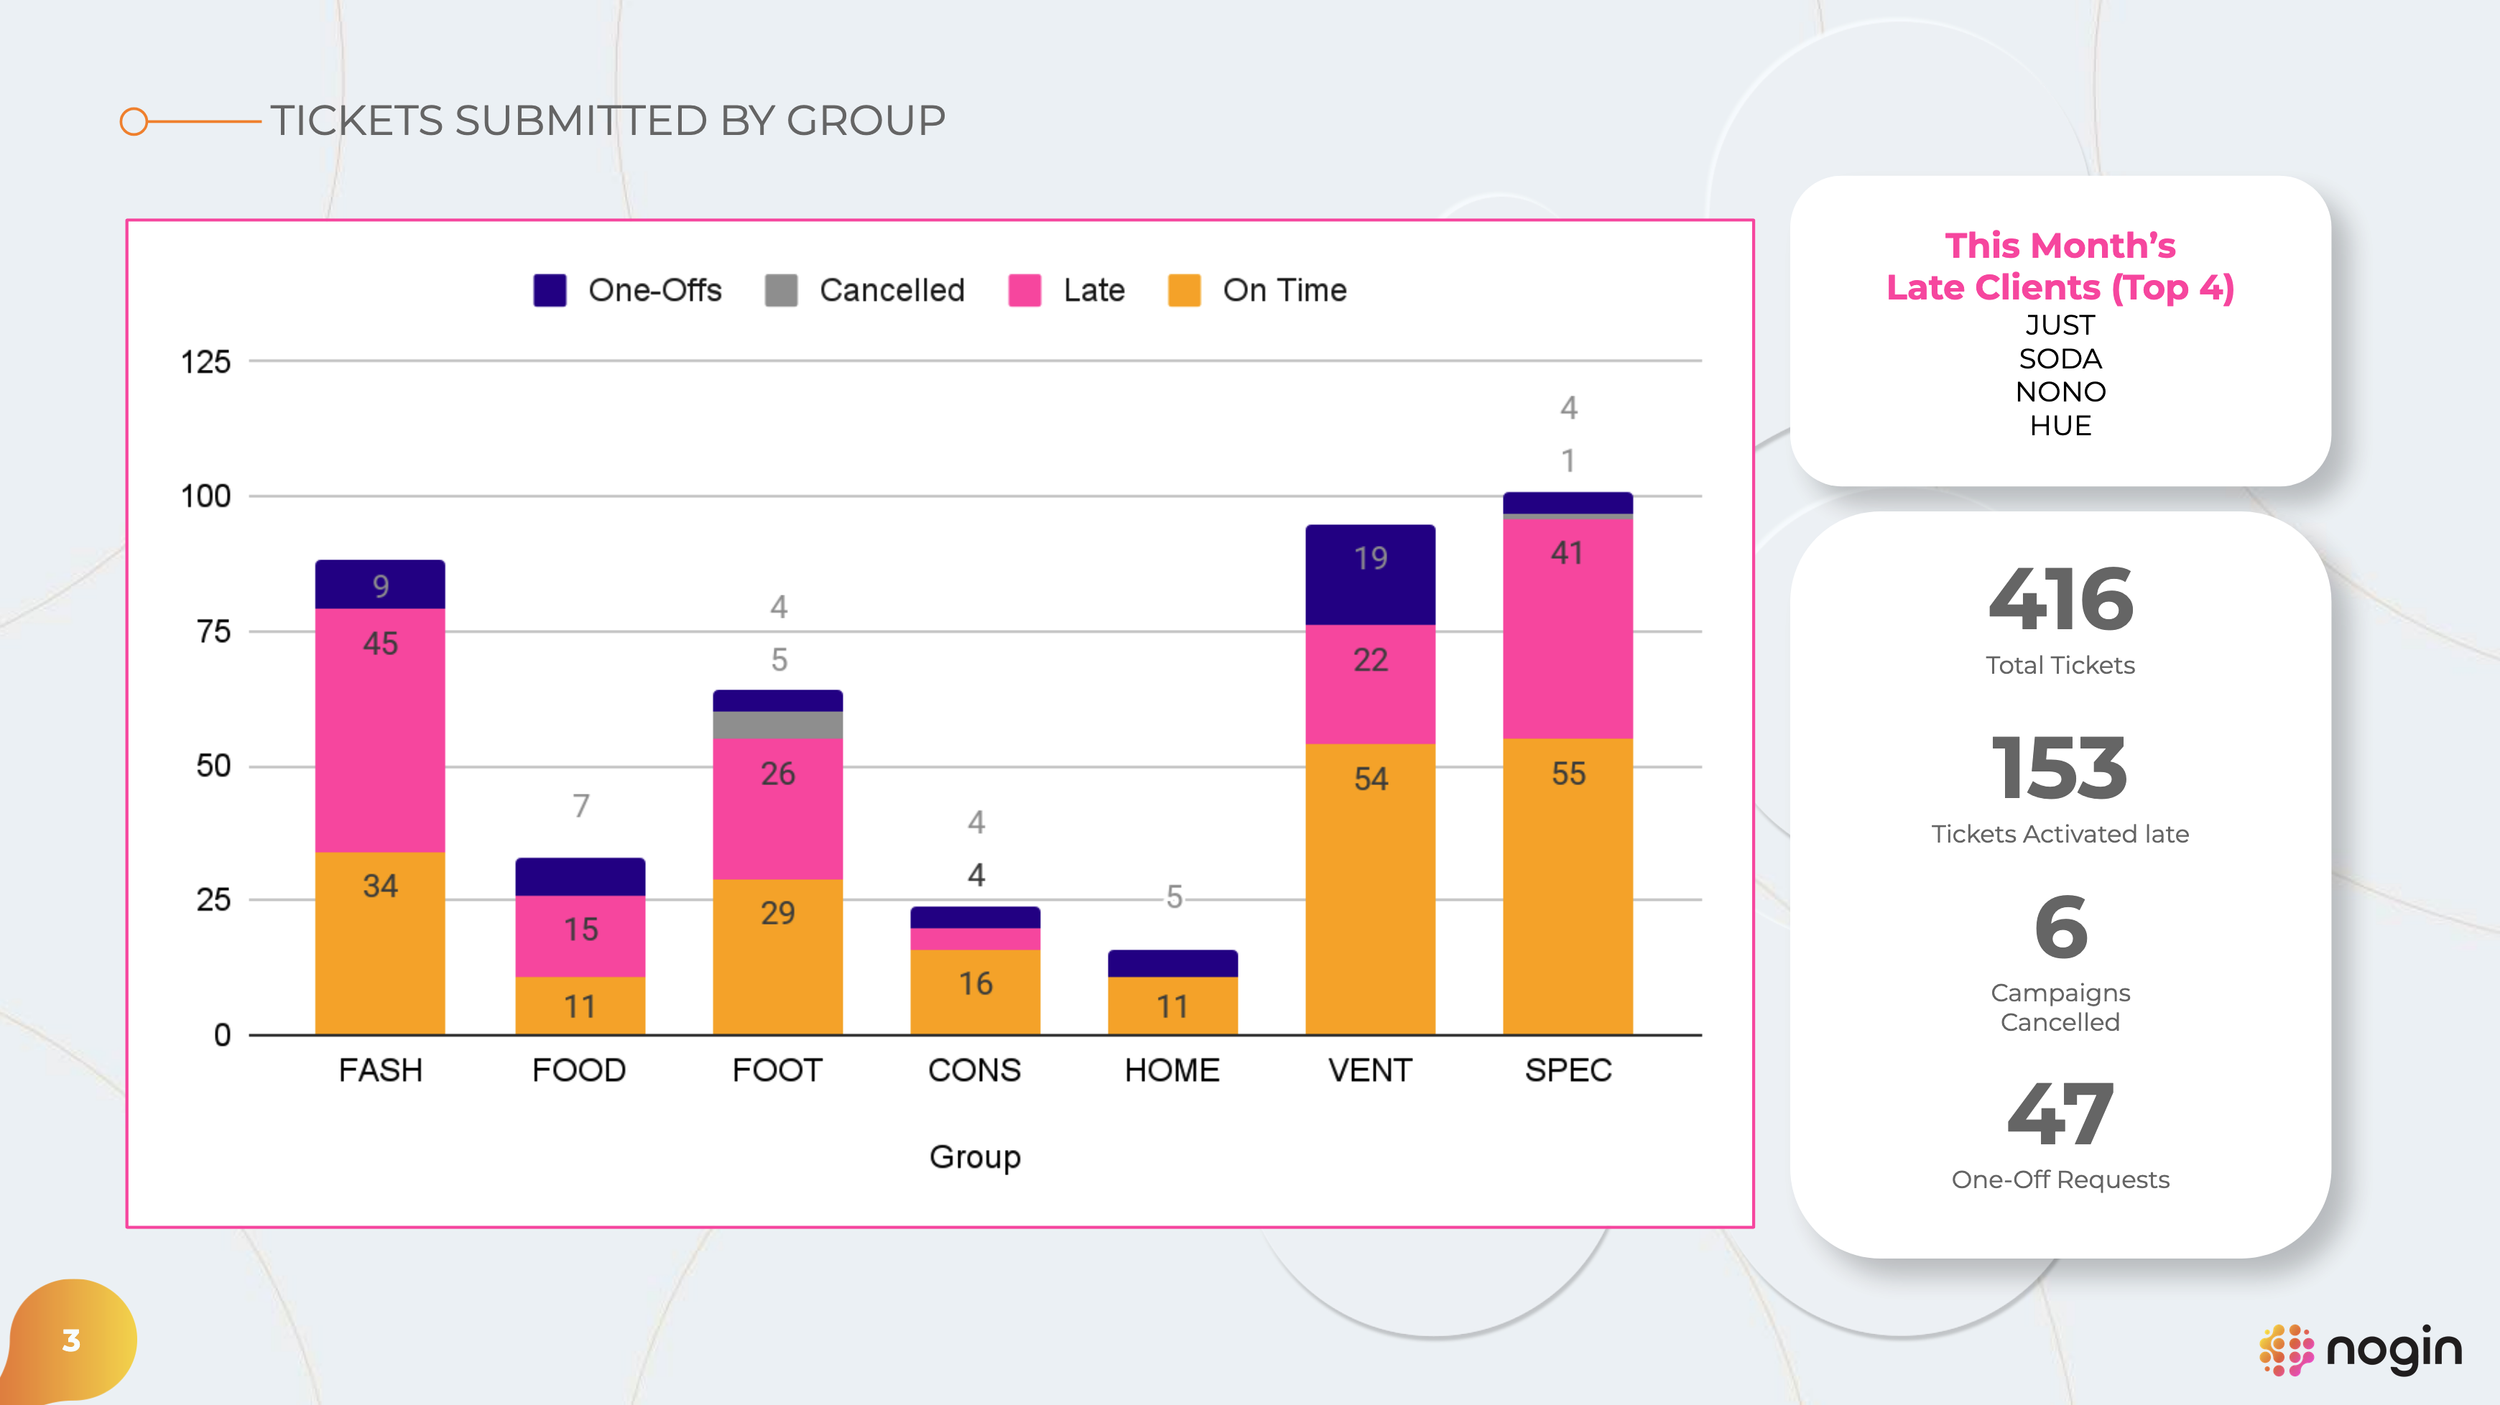
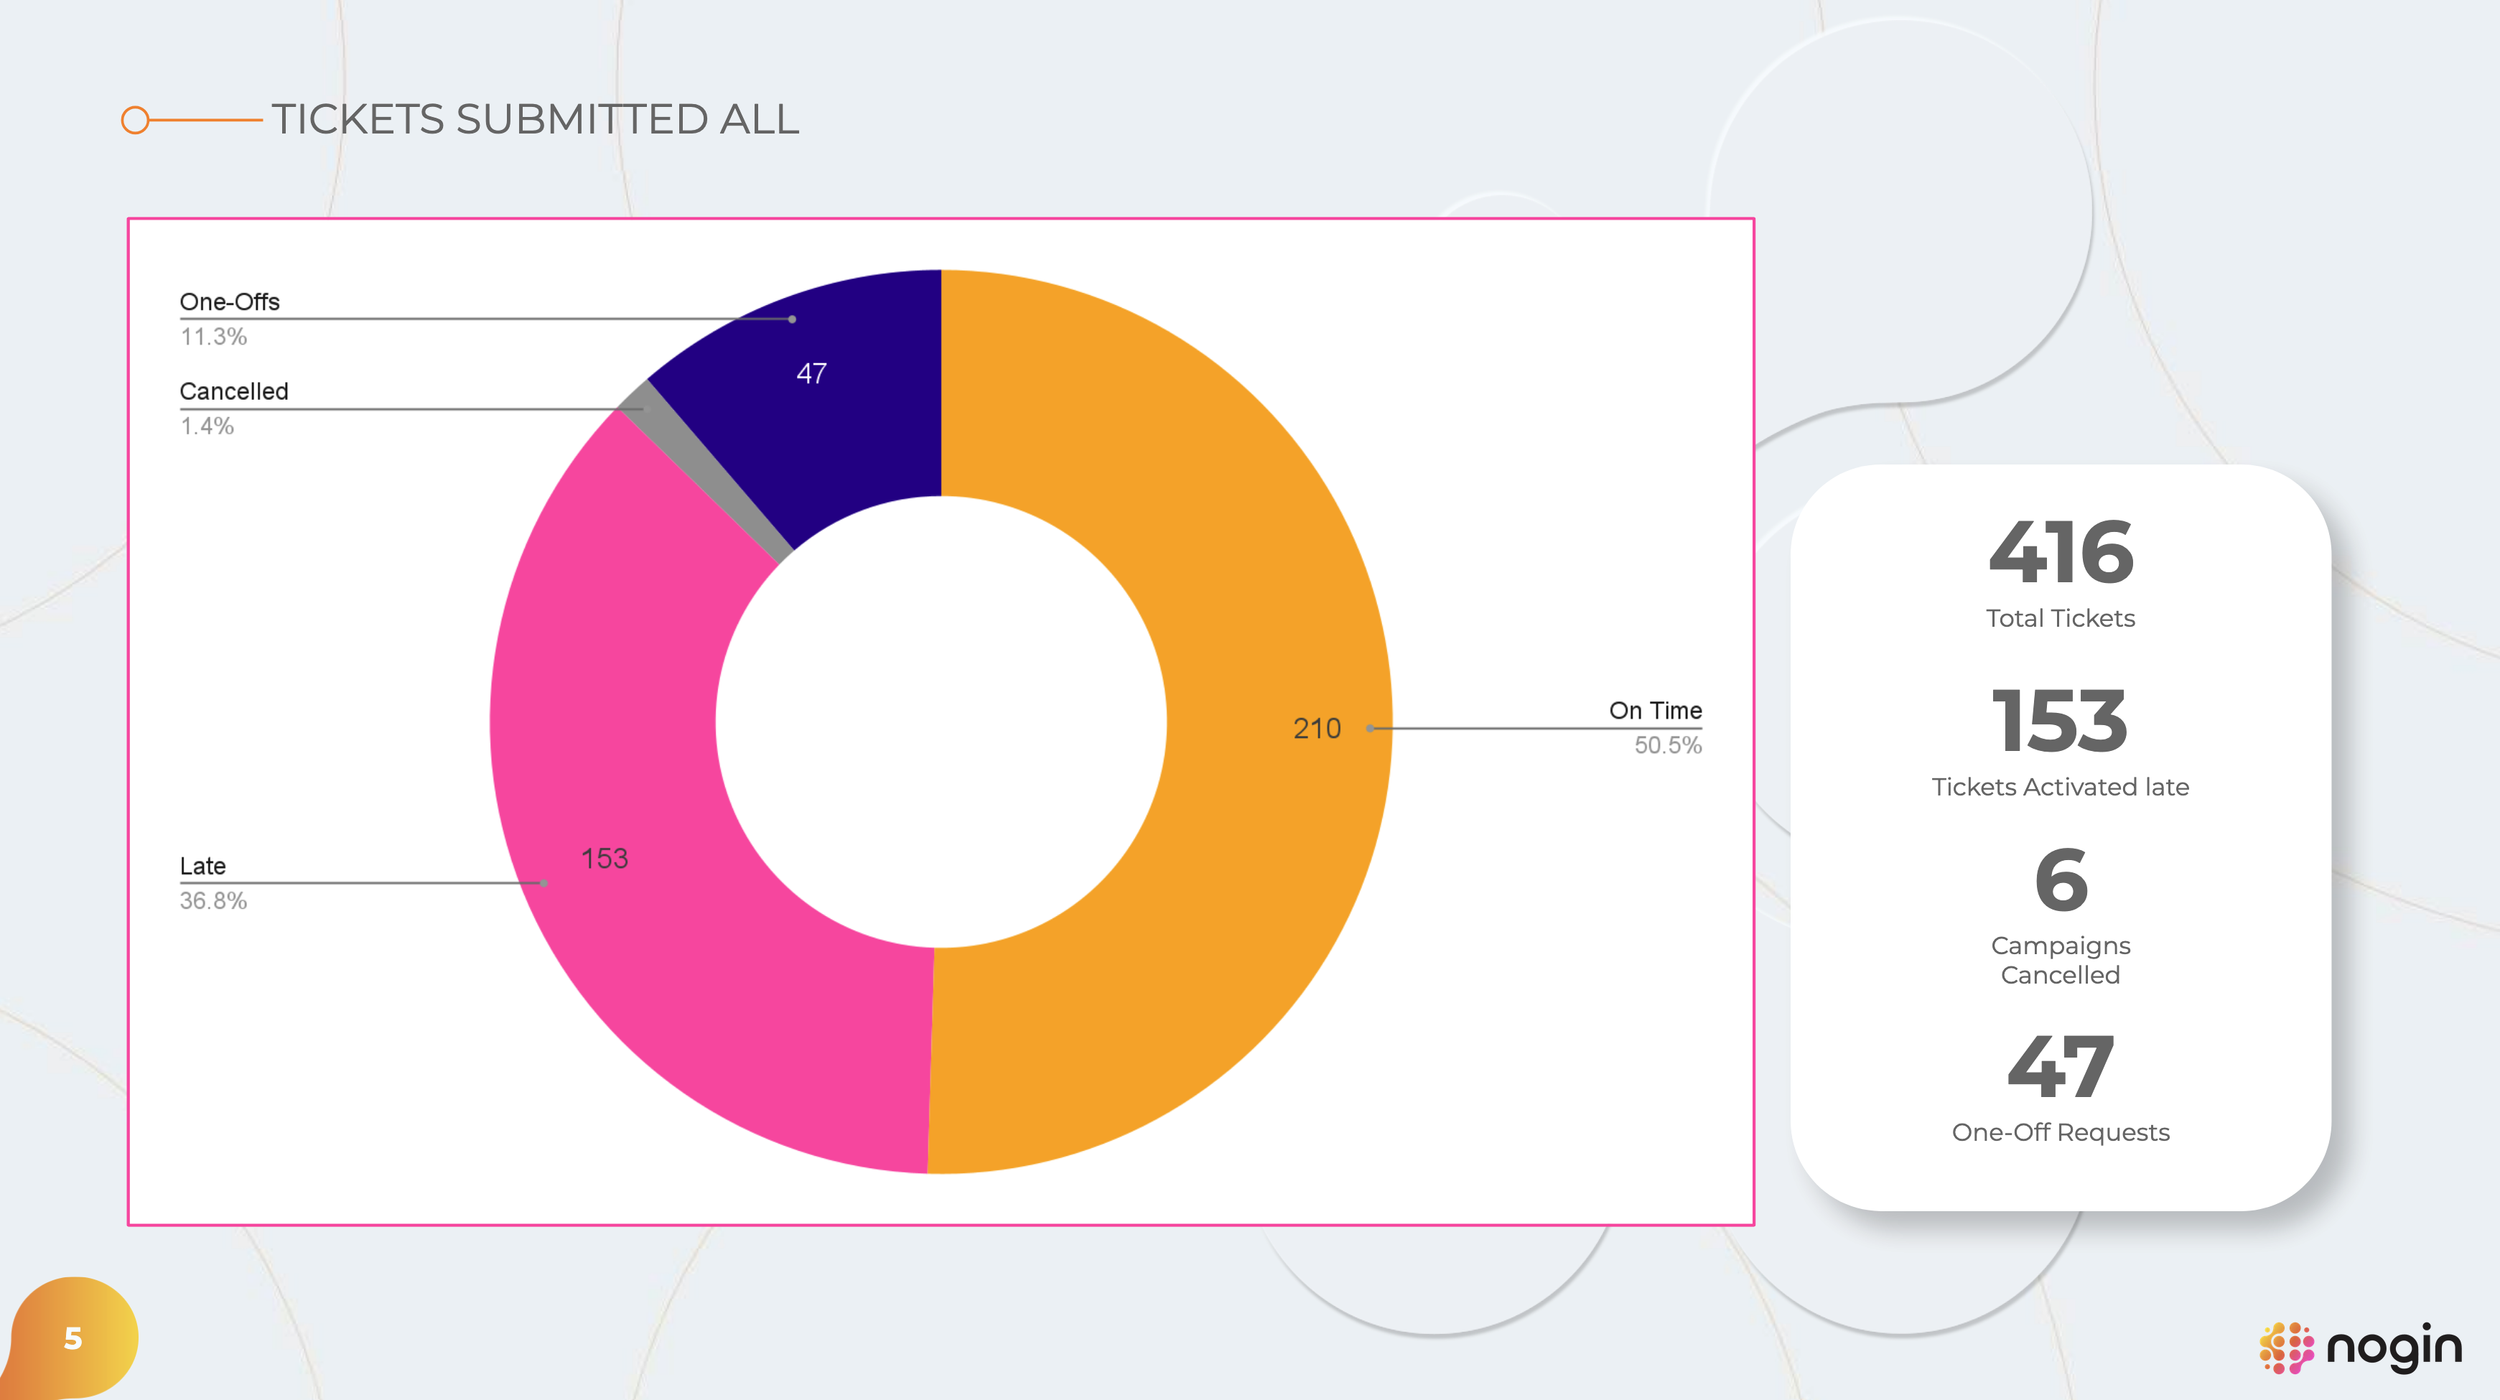
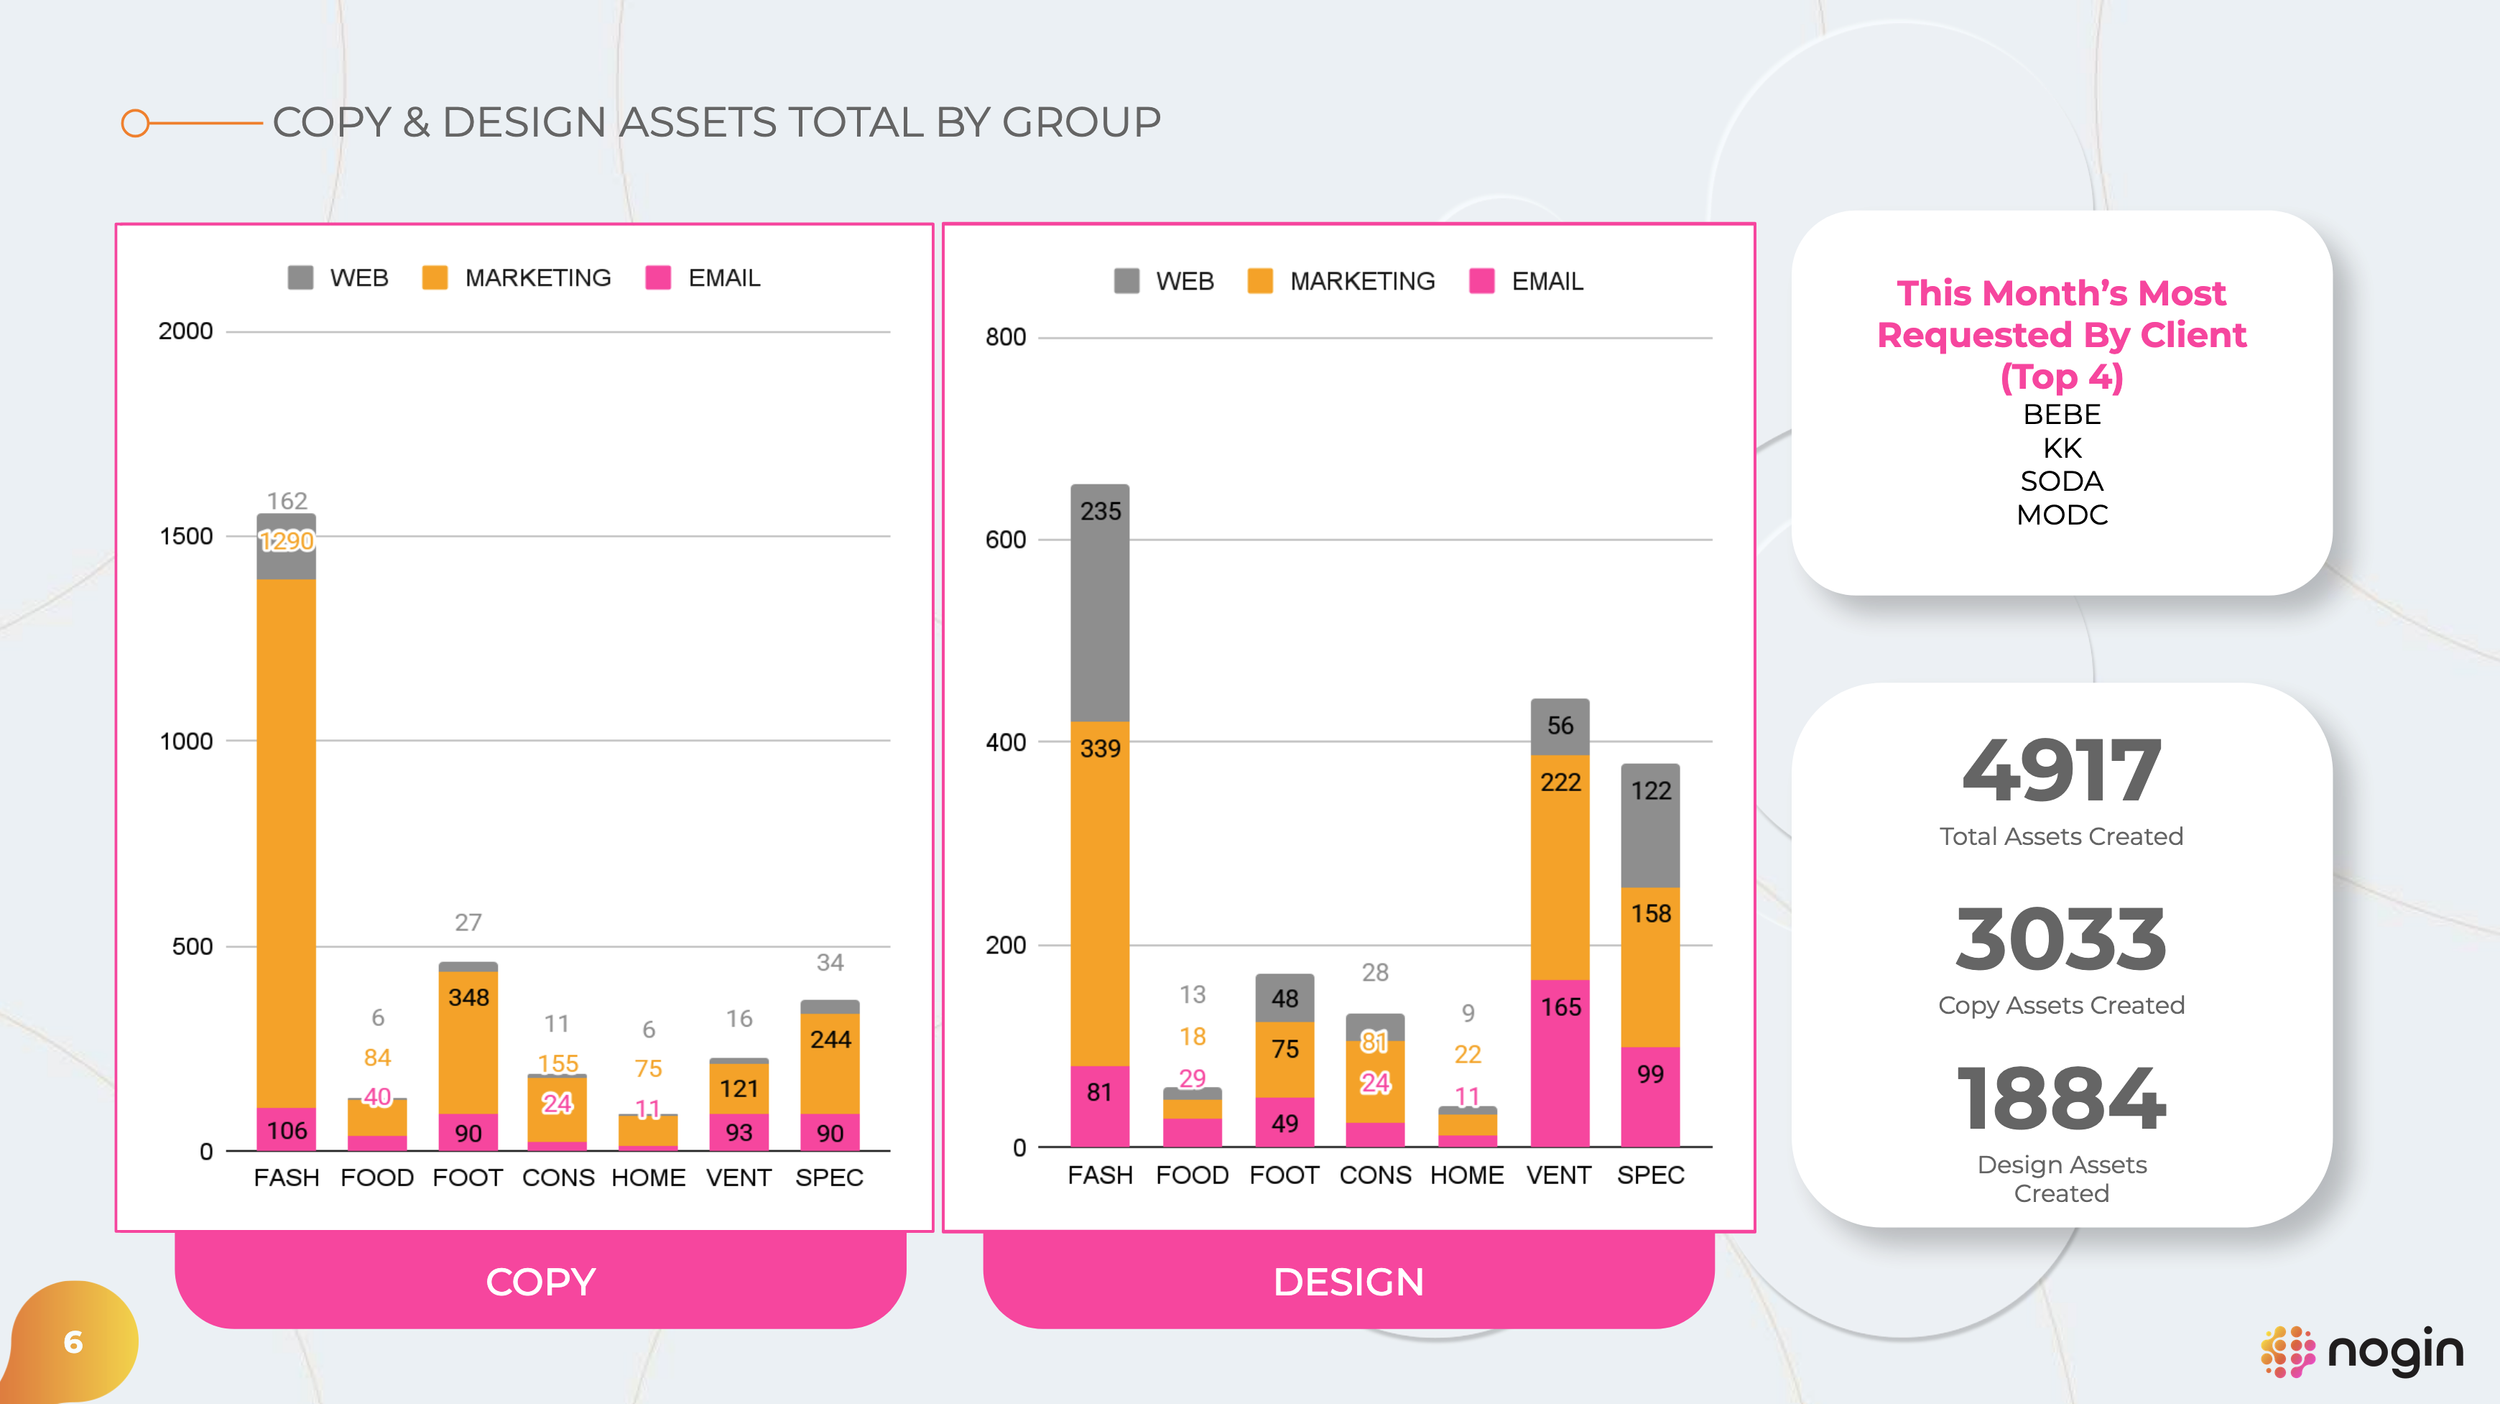
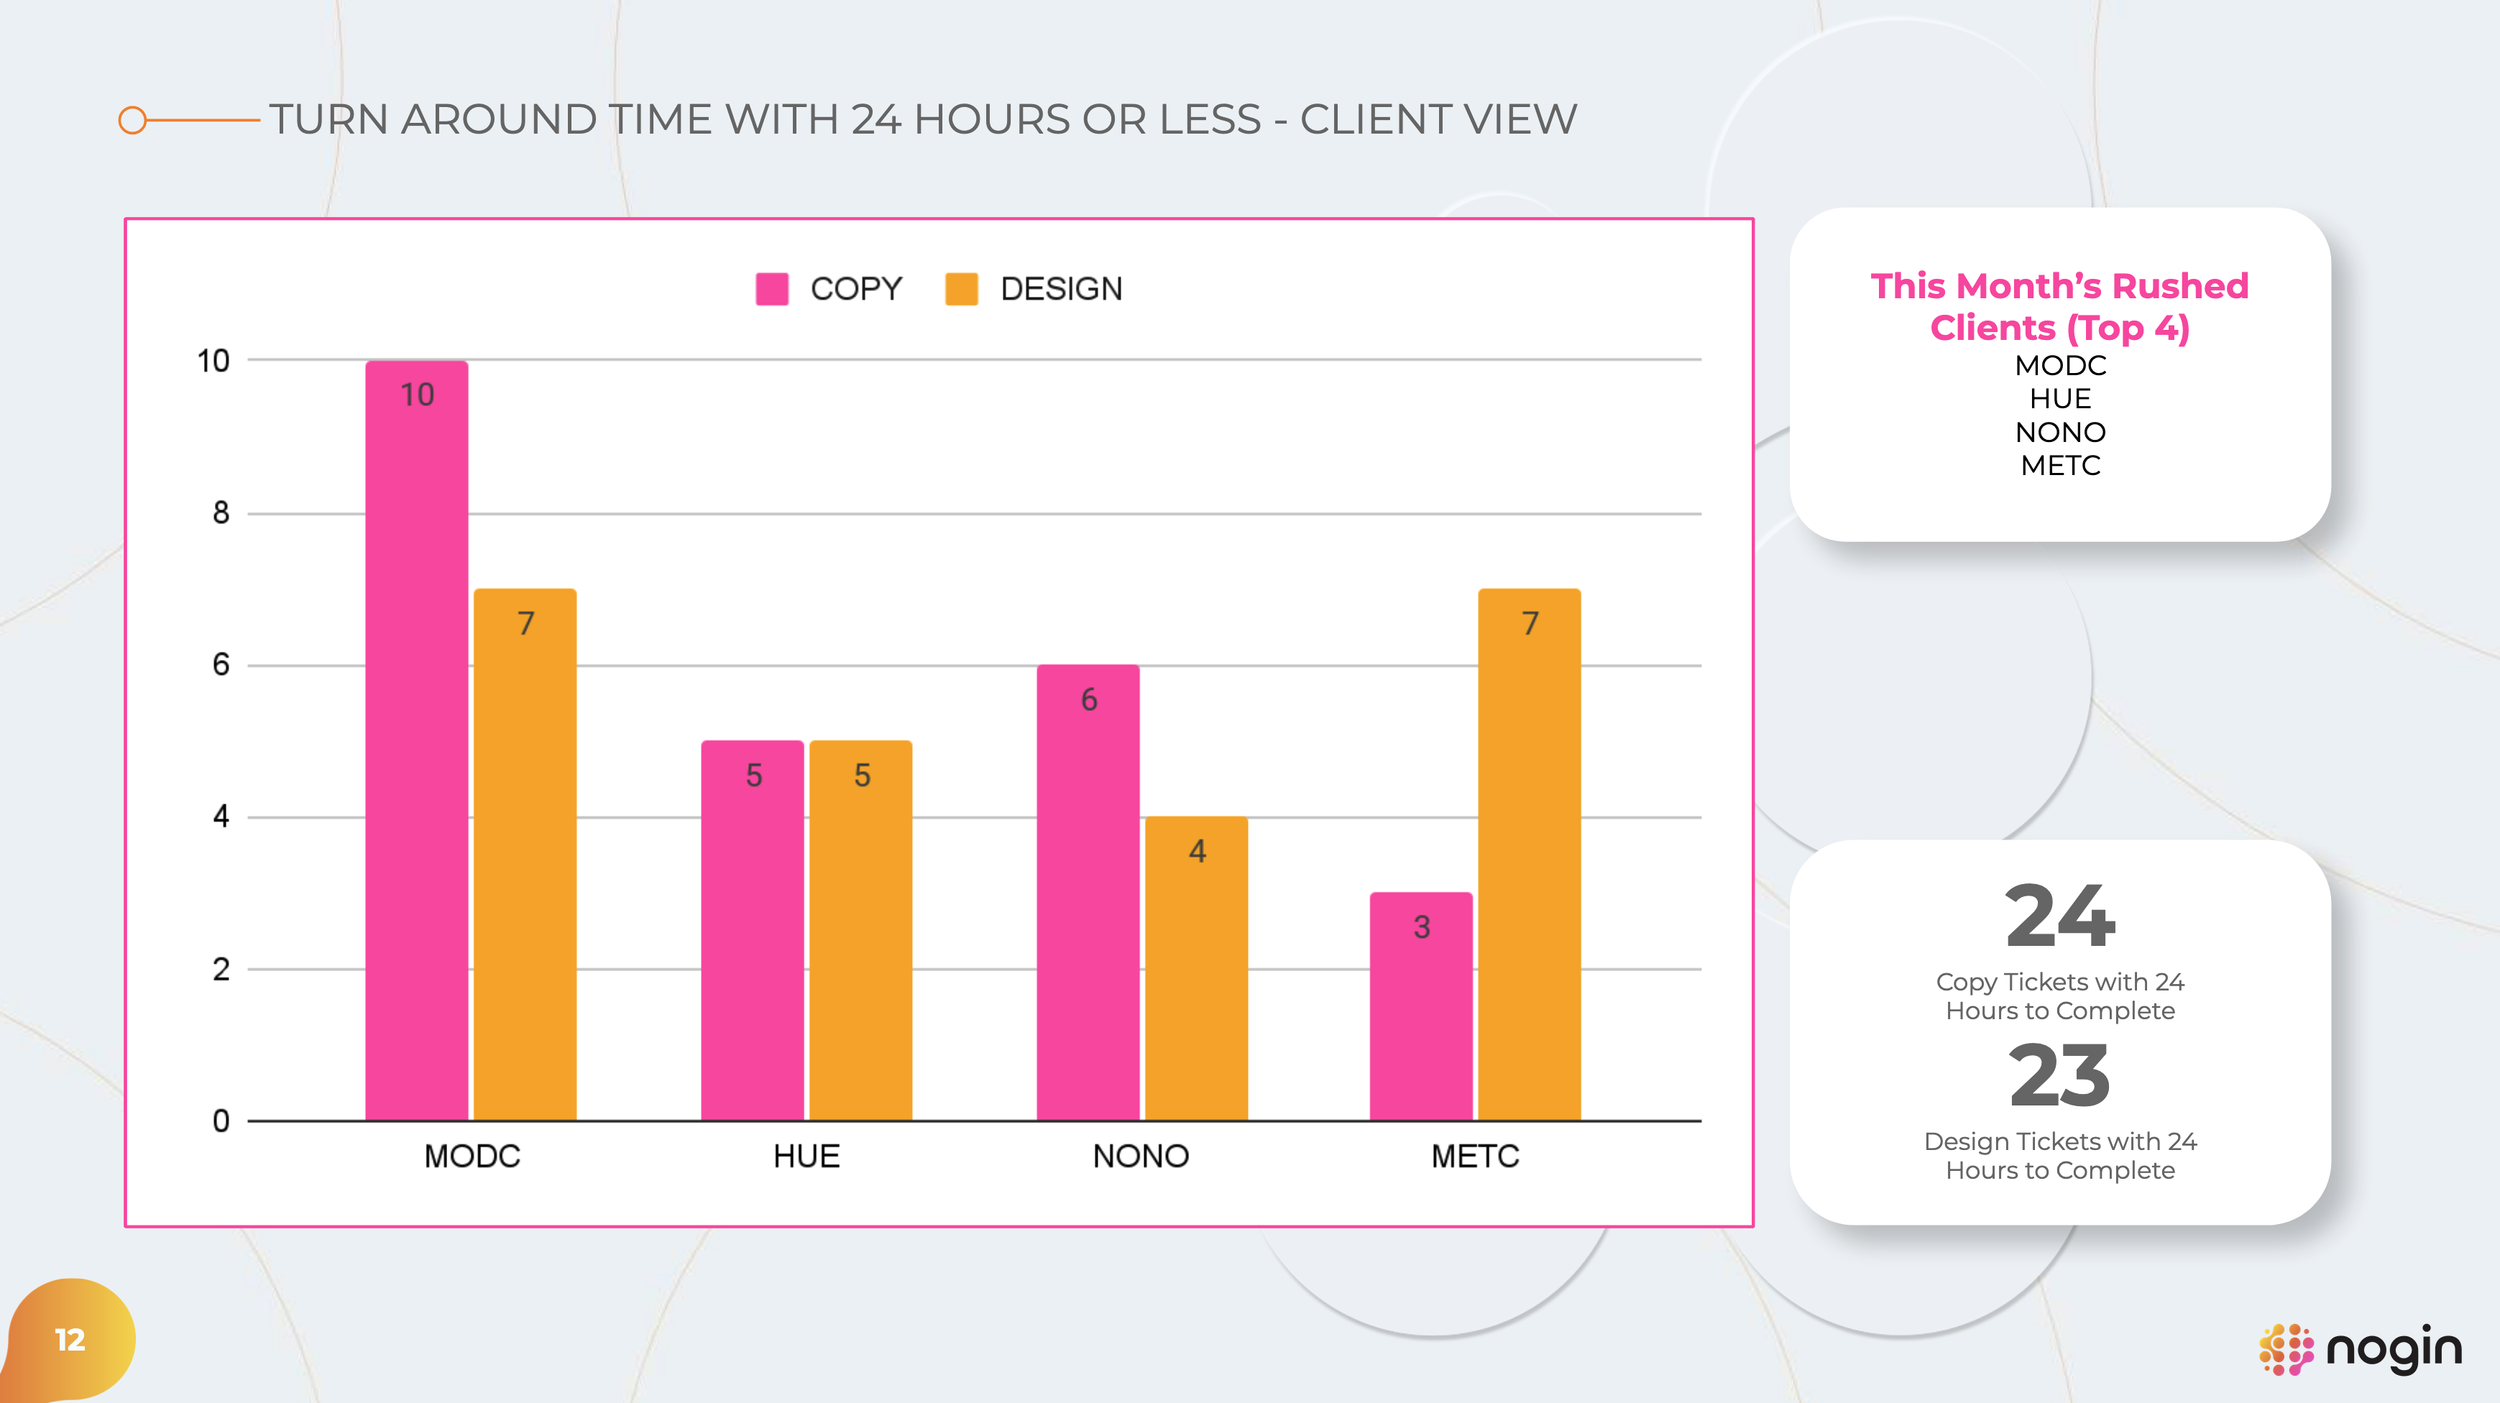
Step 3: Reporting That Drove Action
The final output was a 16‑page report designed to be read, discussed, and acted on. It was reviewed monthly with designers, copywriters, creative leadership, and executives. The goal was clarity, not volume, highlighting what mattered, what changed, and where attention was needed next.
What made this project successful wasn’t just automation. It was building a reporting system that respected creative work while giving leadership the visibility they needed to support it.